Dashboard
View analytics and metrics for your better-auth instance.
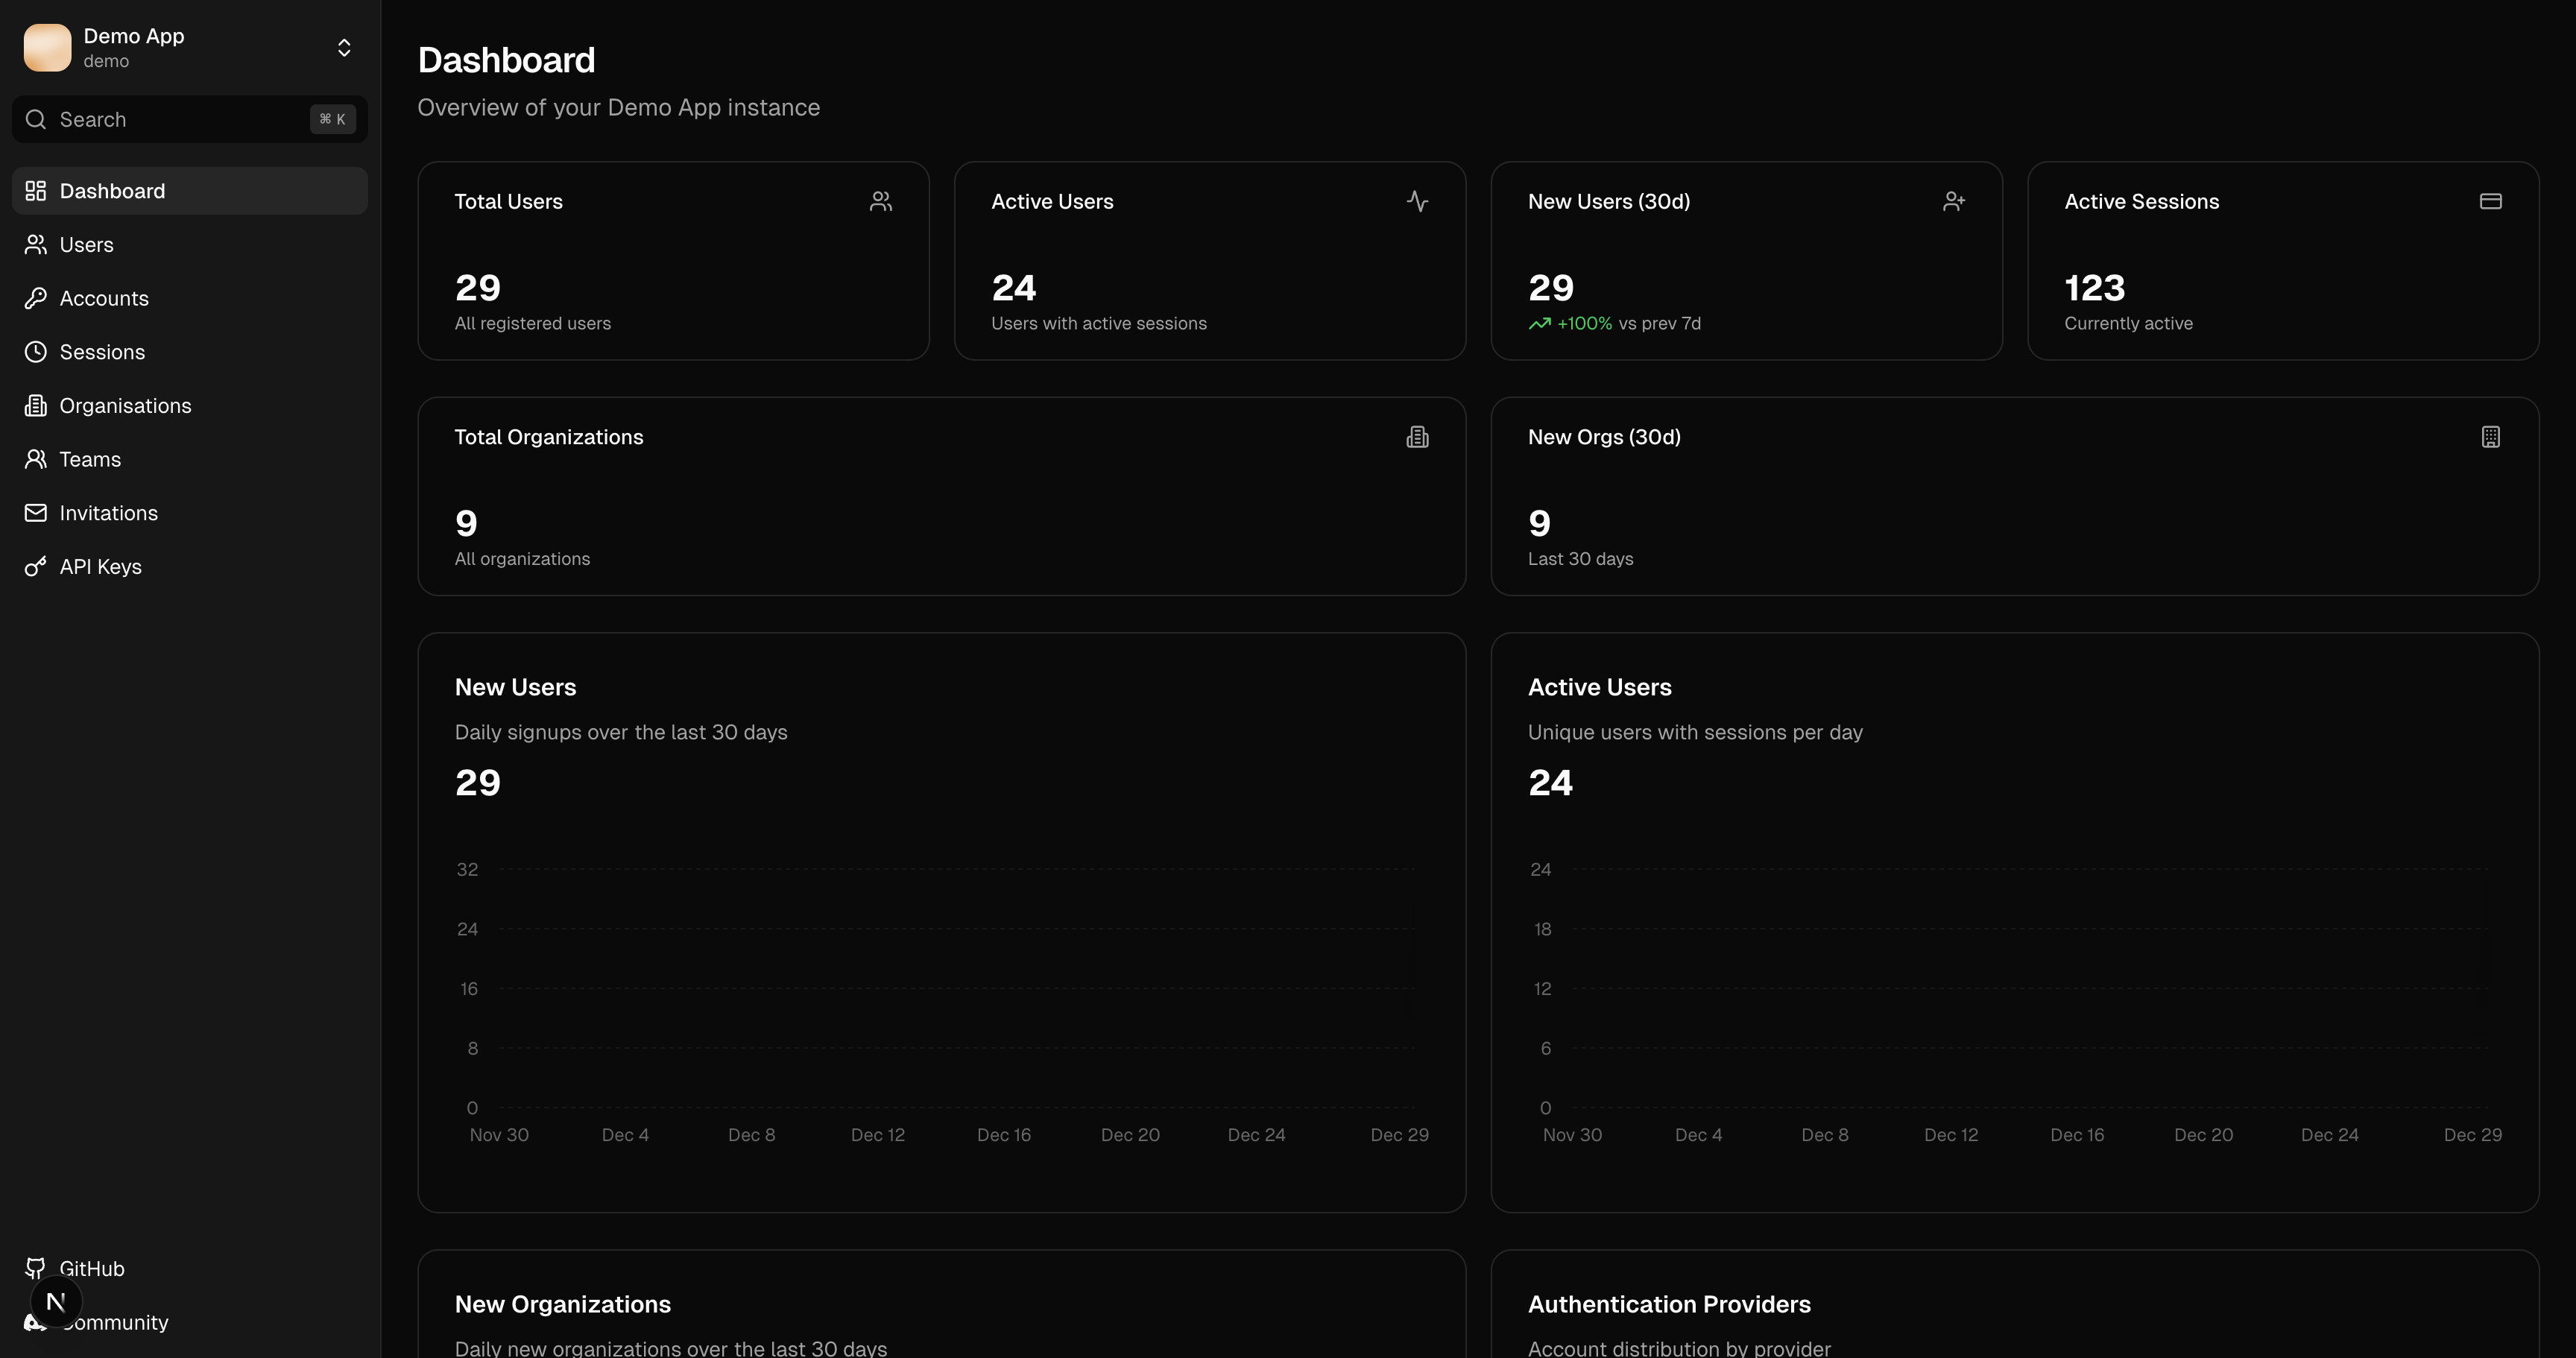
The dashboard provides an overview of your instance's authentication activity.
Metrics
Active Users
The number of users with active sessions. Includes a 30-day trend indicator showing growth or decline.
New Users
Users created in the last 30 days, displayed as a sparkline chart showing daily signups.
Active Sessions
Current active sessions across all users.
Organizations
Total organization count (requires organization plugin).
Provider Distribution
A pie chart showing the breakdown of authentication providers used:
- Email/Password
- GitHub
- Other OAuth providers
This helps identify which authentication methods your users prefer.
Instance Details
The sidebar displays:
- Instance name: Currently selected instance
- Environment: Production, staging, or development
- better-auth version: Auto-detected from schema
Refreshing Data
Dashboard data is fetched when the page loads. Use the browser refresh or navigate away and back to update metrics.